Final Project
Install Dependencies
The template provided for this assignment has additional dependencies. Due to some current issue with this library (as of June 2026), we have to install from source:
$ cd ~/fav/ros2/src && \
git clone https://github.com/teamspatzenhirn/rviz_2d_overlay_plugins.git && \
cd rviz_2d_overlay_plugins && \
git checkout 1.4.0
Get the dependencies:
$ rosdep-ros2
and rebuild the workspace:
$ build_ros
Remember, you have to source the workspace again:
$ source ~/.zshrc
Template Package
Get the Template
$ cd ~/fav/ros2/src && \
git clone https://github.com/FormulasAndVehicles/final_project.git
Remember to build and source your workspace.
Launch the Project
We will use RViz for visualization during the final project. Start the simulation with Gazebo in headless mode:
$ ros2 launch fav simulation.launch.py vehicle_name:=bluerov00 start_gui:=false
Launch the final project:
$ ros2 launch final_project final_project.launch.py vehicle_name:=bluerov00 scenario:=1 use_sim_time:=true use_scenario:=true
The scenario can be chosen using the launch argument scenario. During the final event set the launch argument use_scenario:=false, since a scenario unknown to you will be provided.
RViz should open and look like this:
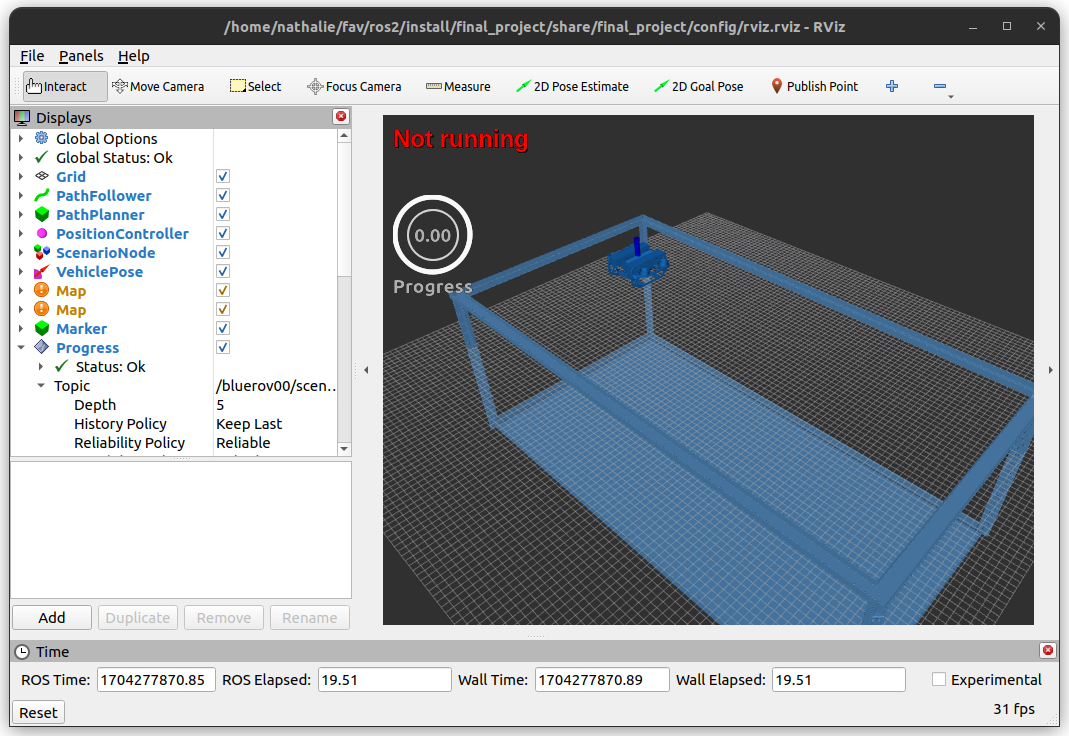
Now, to start the algorithm, you need to call the start service:
$ ros2 service call /bluerov00/scenario_node/start std_srvs/srv/Trigger
Hint
To abort your current run without stopping everything, you can call the following service
$ ros2 service call /bluerov00/scenario_node/reset std_srvs/srv/Trigger
You can now see the viewpoints and obstacles as well as the occupancy grid map. Once a path is found, the BlueROV automatically drives to the next viewpoint (so far using our very simple solution).
It should look like this:
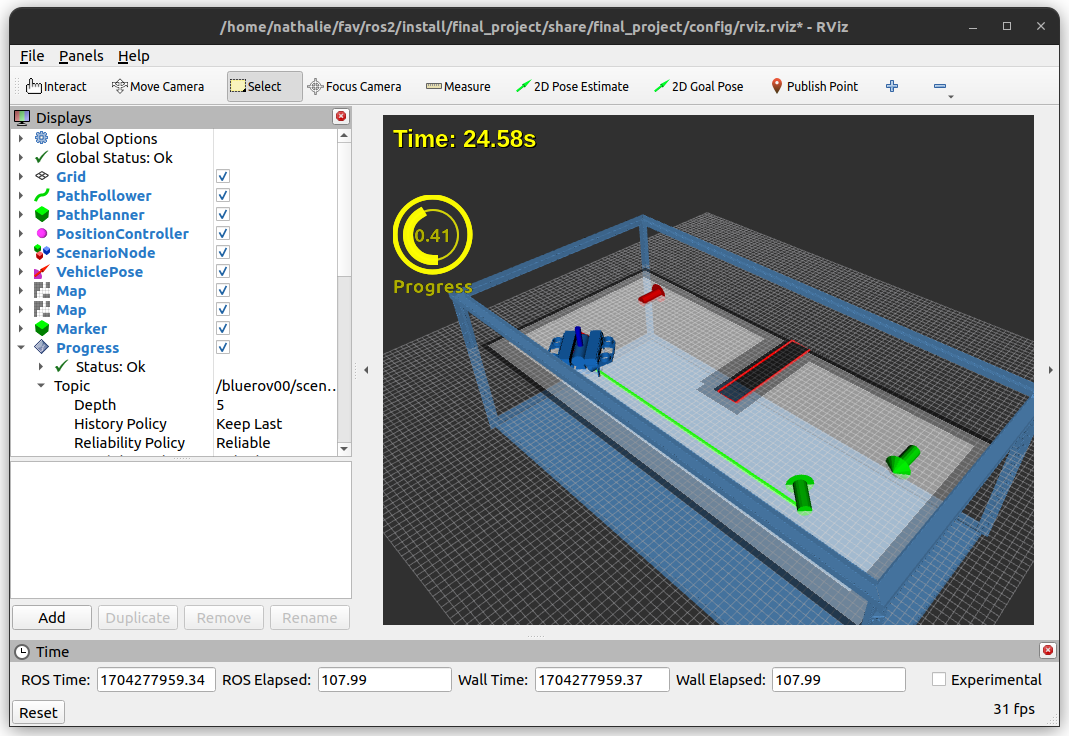
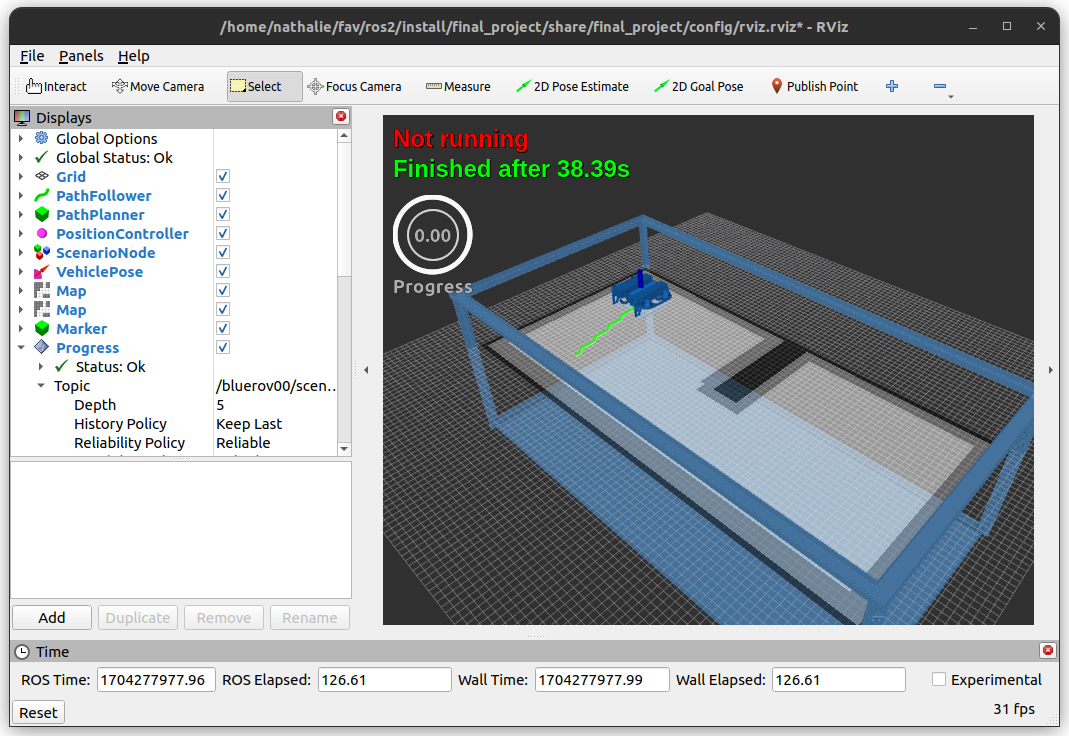
For a viewpoint to be registered as ‘visited’, the robot needs to be in close proximity for a while. The progress is displayed in the overlay chart on the left.
The needed time from start of computation to completion of all viewpoints will be displayed:
Restarting the Algorithm
When you want to rerun your algorithm after a completed run, simply call the start service again. Otherwise, restart the final_project.launch.py launch file and call the start service again.
Scenario Description
We provide you with 3 different scenarios. Furthermore, feel free to construct your own scenarios.
You can find the scenario files here: config/scenario_X.yaml
A scenario is described by obstacles and viewpoints. Each obstacle is a polygon with n corner points, described by their x and y coordinate. We use a pose to describe each viewpoint (position + quaternion desribing the orientation). However, only the x and y position, as well as the yaw angle are relevant.
Hint
The first scenario is constructed to work with our baseline solution. Expect this scenario to be the closest to the given scenario in the live demo. However, the viewpoints will not be ordered by the distance to the start.
The second scenario only consists of a start viewpoint and a second viewpoint in order to give you something simple to test your path planning algorithm.
The third scenario includes some fancier obstacles. Since space is (unfortunately) limited in the real water tank, we will not use as many large obstacles in the live demo.
Note
No one stops you from creating your own scenarios if you feel like the given scenarios do not satisfy your needs.
Structural Overview
The scenario_node loads a scenario as described in the previous section and publishes two important topics
obstaclesas scenario_msgs/PolygonsStampedviewpointsas scenario_msgs/Viewpoints
- obstacles
Contains a list of polygons that represent obstacles. These messages are used by the mapper node to create a corresponding occupancy grid map.
- viewpoints
Contains a list of viewpoints. Each viewpoint has the following structure
$ ros2 interface show scenario_msgs/msg/Viewpoint
std_msgs/Header header
   ...
geometry_msgs/Pose pose
   Point position
      float64 x
      float64 y
      float64 z
   Quaternion orientation
      float64 x 0
      float64 y 0
      float64 z 0
      float64 w 1
float64 progress
bool completed
It contains the information about the viewpoint’s pose, but also the
completedfield will be of particular interest. This way, we are informed if a viewpoint is considered completed and, if that is the case, that we can start visiting the next viewpoint.
Provided Nodes
Mapper
This node computes an occupancy grid map.
In the file config/mapping_params.yaml, you can change the discretization.
All obstacles included in the scenario description will automatically be included in the grid map. Additionally, we have already implemented a safety margin around all obstacles. Since the BlueROV’s real size is not necessary identical with the grid cells’ size, the obstacles need to be inflated and additional grid cells marked as occupied in order to avoid collision. In order to adjust this inflation size, have a look at this node’s source code.
Apart from this, you should not need to touch this node.
Path Planner
This is one of (if not the) core nodes.
Do not feel obliged to stick with our base line implementation in any way (it does not even have to be occupancy-grid-map-based if you prefer some other method).
Still, we recommend to keep the services/clients of this node as they are.
The scenario_node calls these services and might get upset if they are not available.
But feel free to extend the service callbacks as you see fit.
Path Follower
The path_follower tries to follow a given path via pure pursuit.
The path is set via the set_path service.
Most likely, services are a new concept to you.
But they will feel very similar to messages.
If needed, look up the tutorials in the official ROS2 docs.
Again, a callback is registered as for a subscription as well.
The whole flow can be described as follows.
The scenario_node publishes a list of viewpoints and the path_planner computes path segments based on these viewpoints.
In our baseline implementation, these segments are straight lines between the viewpoints and discretized to fit the occupancy grid map.
The path_planner then calls the set_path of the path_follower.
As soon as the current path segments target viewpoint is declared completed by the scenario_node, the path_planner calls the set_path service with the next path segment.
This repeats until all viewpoints have been visited.
Our baseline implementation does perform collision detection but does not perform collision avoidance.
Thus, if an obstacle is in the way when the viewpoints are connected via straight-line-paths, the path_planner will consider this scenario infeasible and will give up.
Position Controller
This is a very basic implementation to get a fully functional baseline implementation of the whole system. We are confident that you have already implemented much better performing controllers during this class. Do not hold back, improve ours or use your own!
We would like to encourage you to keep time timeout implementation in place. After a certain timeout period during which no setpoints have been received, the controller emits zero setpoints. Inside the simulation this won’t matter much. But for the lab sessions, it might proof useful.
Yaw Controller
The same as for the position controller applies for the yaw controller.
Rviz
If you are using a 4k monitor, the RViz overlays showing the status and progress of the scenario might not be displayed correctly.
You can change the size of the circular progress display in config/rviz.rviz here:
- Class: rviz_2d_overlay_plugins/PieChartOverlay
Enabled: true
Name: Progress
Topic:
   Depth: 5
   Durability Policy: Volatile
   History Policy: Keep Last
   Reliability Policy: Reliable
   Value: /bluerov00/scenario_node/viewpoint_progress
Value: true
auto color change: true
background color: 0; 0; 0
backround alpha: 0
clockwise rotate direction: true
foreground alpha: 0.699999988079071
foreground alpha 2: 0.4000000059604645
foreground color: 255; 255; 255
left: 10
max color: 0; 255; 0
max color change threthold: 0.75
max value: 1
med color: 255; 255; 0
med color change threthold: 0.10000000149011612
min value: 0
show caption: true
size: 80
text size: 14
top: 80
Final Event
Note
You will need the following instructions for the final event ONLY. Since we will provide you with a scenario unknown to you, you will not be able to test your algorithm on this scenario beforehand. Thus, the instructions in this section are only relevant for the final event.
Modify the Setup
For the demonstration of the final project in our lab, we need you to remove both the scenario_node and the robot_marker_publisher from your launch setup.
We will run these nodes on another machine.
Attention
Not removing these nodes from your launch setup will cause node/topic collisions.
Remove this code block from final_project/launch/final_project.launch.py
74Node(
75    executable='scenario_node',
76    package='fav',
77    parameters=[
78        {
79            'scenario': LaunchConfiguration('scenario'),
80            'use_sim_time': LaunchConfiguration('use_sim_time'),
81        },
82    ],
83),
84Node(
85    executable='robot_marker_publisher',
86    package='fav',
87    parameters=[
88        {
89            'use_sim_time': LaunchConfiguration('use_sim_time'),
90        },
91    ],
92),
Since we will show the rviz visualization as well, you might consider removing the rviz node as well for performance reasons.
But that is up to your personal preferences.
 95rviz_file = str(
 96   get_package_share_path('final_project') / 'config/rviz.rviz')
 97
 98action = Node(
 99   executable='rviz2',
100   package='rviz2',
101   name='rviz2',
102   arguments=['-d', rviz_file, '--ros-args', '--log-level', 'error'],
103)
104launch_description.add_action(action)
Run the Code
Also keep in mind that we need to adapt the launch command to run the setup slightly, because we do not need sim time for the lab. We do not need to specify a scenario either.
$ ros2 launch final_project final_project.launch.py vehicle_name:=bluerov01 use_sim_time:=false